
FXS Divergence
Characteristic: Trend Reversal
Length: 5 controls the measurement period for the average
Factor: 2 controls the placement of the bands around the average
Purple square = Bearish divergence
Light blue square = Bullish divergence
Yellow dots = Bearish break level
Pink dots = Bullish break level
Momentum indicators such as the RSI and Stochastics are very popular tools that are best used as overbought and oversold in consolidating markets. During trends they will invariably be poor trading indicators because uptrending markets can stay overbought and keep rising, and downtrending markets can stay oversold and keep falling. However, there is one use of momentum indicators, called "Divergence? that can alert traders to potential trend reversals.

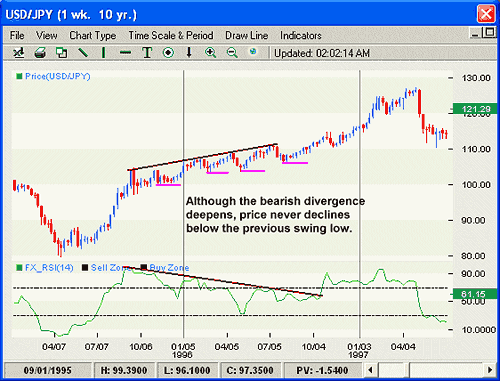
The chart above displays examples of both bearish and bullish divergences. On the left it can be seen that price has made new highs while the FXS-RSI actually made a corresponding lower high. The opposite happens on the right of the chart. Price declines to new lows while FXS-RSI fails to confirm those new price lows. This is called a price-momentum divergence. That is, price is making a new extreme for the trend but with a lack of momentum, as shown in this case by FXS-RSI. On the face of it, this looks like an excellent tool to spot trend reversals. However, divergences can extend for quite some time before they get "triggered? Let us look at the dangers of relying on divergence alone.

The chart shows the weekly USDJPY market as it rallied after the historic 79.75 low in April 1995. By the end of 1995 and the beginning of 1996 the momentum of the rally had stalled and as higher price highs were recorded, FXS-RSI failed to match those new peaks. It was a classic bearish divergence, but as we can see, it never translated into a significant reversal and indeed, eventually price continued higher. The basis of a trend must be remembered at this point. An uptrend is a series of rising peaks and troughs. Until those troughs are breached, the trend cannot be said to have reversed. Clearly, in this example, the declines from each new peak never broke below the previous corrective low and therefore the divergence cannot be said to have been completed.
FXS-Divergence - Usage
During trading and analyzing it is quite easy to forget to spot all the different signals that arise. In the heat of the trend it is quite possible to overlook a divergence. While divergences are difficult to define mechanically due to the varied nature of spans between trend extremes and the ability to spot key reversal highs/lows, FXS-Divergences has been designed to identify a great number of them. Not only that, but bearing in mind the lesson we have learned from "counting ones chickens too early? it also provides approximate break levels that confirm whether the divergence is valid.
It must be emphasized that the break levels cannot be used without due attention to other forms of analysis such as trend lines and trailing stops. Thus it should be used within the context of a total integrated analysis.

As we can see, used correctly the break levels prevent early exits in the development of a trend or when price has merely diverged within a period of consolidation as was evident in the center of the chart during the sideways pricemovement. However, they also remind us to look carefully at the right times to make sure we do not forget the potential for price reversal.
Indicator Descriptions
FXS Indicators
Moving Average
Schaff Indicators
Schaff & FXS Experts
Standard Indicators
- Two Lines
Moving Average
- Two Lines